
https://www.youtube.com/watch?v=yzIMircGU5I&list=PL5-da3qGB5ICCsgW1MxlZ0Hq8LL5U3u9y&index=1
read a tabular data file
cols = ['col1', 'col2']
pd.read_table(path, sep='|', headers=None, names=cols)
pd.head()	# first five rows
commands end with parentheses
df.describe() #show mean, std, max, min...
rename columns
df.rename(columns = {'old_col_name':'new_col_name'}, inplace=True)
cols = new_col_list
df.columns = cols
df.columns = df.columns.str.replace(' ', '_')
remove columns
df.drop('col', axis=1, inplace=True)
df.drop([rows], axis=0, inplace=True)
sort
df['col'].sort_values(ascending=False) # series
df.sort_values('col')	# return dataframe
df.sort_values(['col1', 'col2'])
filter rows of a pandas DataFrame
pd.Series([])
df[df['col'] >= 200]
#	df[df['col'] >= 200]['col2']
df.loc[df['col'] >= 200, 'col2']	#	loc select cols or rows with labels
multiple filter criteria
df[(df['col'] >= 200) | (df['col1'] == 'a')]
df['col'].isin(['a', 'b', 'c'])
read two columns
pd.read_csv(path, usecols=['a', 'b'])
pd.read_csv(path, nrows=3)
iteration
for c in df['col']:
	print(c)
for index, row in df.iterrows():
  print(index, row['a'], row['b'])
filter numerical columns
import numpy as np
df.select_dtypes(include=[np.number]).dtypes
describe method
df.describe(include=['object', 'float64'])
“axis” parameter
df.mean()	# mean value for serires
df.mean(axis=1)	# row mean
string methods
df['col'].str.upper()	# uppercase
df['col'].str.contains('str')	#	return series of t/f
df[df['col'].str.contains('str')]
df['col'].str.replace('a', 'b').str.replace('c', 'd')	# support regex
change the data type
df.dtypes
serires.dtype
df['col'] = df['col'].astype('float64')

df = pd.read_csv(path, dtype=('col1':float))
df['col'].str.replace('$', '').astype(float).mean()
groupby
df.groupby('col1').mean()
df.groupby('col1')['col2'].mean()
df.groupby('col1')['col2'].agg(['count', 'min', 'max', 'mean'])
%matplotlib inline
df.groupby('col1')['col2'].mean().plot(kind='bar')
pandas Series
df['col'].describe()
df['col'].value_counts()
df['col'].value_counts(normalize=True)
df['col'].unique()
df['col'].nunique()	# number of unique values
pd.crosstab(df['col1'], df['col2'])
df['col1'].plot(kind='hist')
handle missing values
df.tail()
df.isnull().head()
df.isnull().sum()
df.dropna(how='any', inplace=True)	# drop a row if it contains null
df.dropna(subset=['col1', 'col2'], how='any')	# drop a row if col1 or col2 is null
df['col'].value_counts(dropna=False)
df['col'].fillna(value='A', inplace=True)
pandas index
df.index
df.columns
df.shape

df.loc[23, 'a']	#	fetch value
df.decribe().loc['25%', 'col']

df.set_index(Series, inplace-True)

df['col'].value_counts()['value1']
df['col'].value_counts().sort_values()
df['col'].value_counts().sort_index()

pd.Series(value array, index=[indices])
pd.concat([df1, df2], axis=1)
select multiple rows and columns
df.loc[index, col_name]	# by label
df.iloc[:, [0, 3]]	# by indices

df= pd.read_csv(path, index_col='col1')
df.ix['row_label', 0]	# mix labels and indices (not recommend)
df.ix[1, 'col_label']
df.ix['col1':'col3', 0:2]
make DataFrame smaller and faster
df.memory_usage(deep=True)
df['col'].astype('category')
df['col'] = df['col'].astype('category', categories=['good', 'veray good', 'excellent', ordered=True])
pandas with scikit-learn
pd.DataFrame({'id':array1, 'col':array2}).set_index('id').to_csv('1.csv')
df.to_pickle('1.pkl')
df.read_pickle('1.pkl')
loc and iloc
df.loc[0:4, :]	#	inclusive-label
df.iloc[0:4, :]	# exclusive-index
large csv
df.sample(n=3, random_state=42)
df.sample(frac=0.75)
train = df.sample()
test = df.loc[~df.index.isin(train.index), :]
dummy variables
df['sex_male'] = df['sex'].map({'female':0, 'male':1})
pd.get_dummies(df['sex'], prefix='sex')
date and times
df['time'] = pd.to_datetime(df['time'])
df['time'].dt.weekday_name
df['time'].dt.dayofyear
df.loc[df['time'] > pd.to_datetime('1/1/1999'), :]
(df['time'].max() - df['time'].min()).days
find and remove duplicate rows
df['col'].duplicated().sum()
df.loc[df.duplicated(keep='first'), :]	#	'last' False
df.duplicated(subset=['col1', 'col2'])
avoid a SettingWithCopyWarning
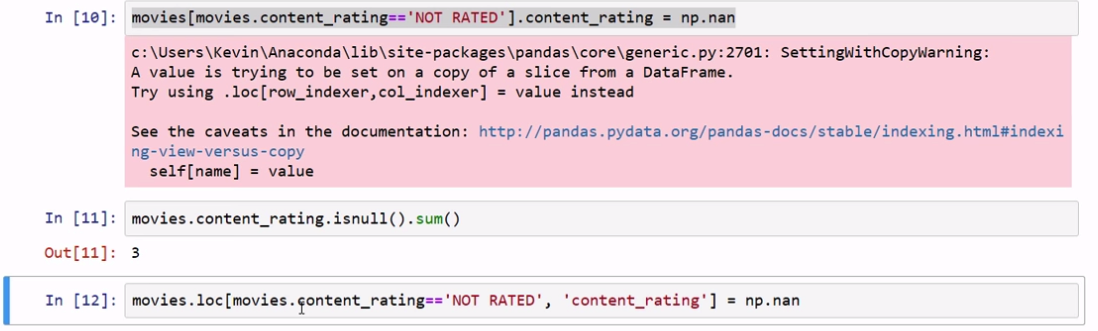
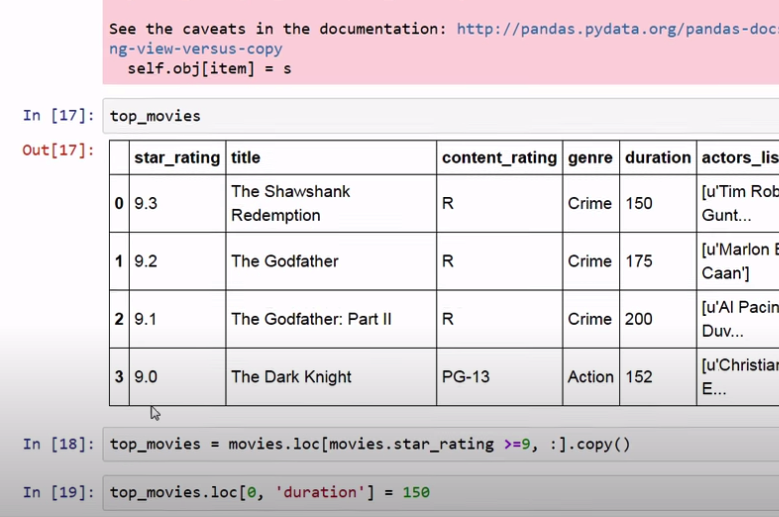
Not sure if it is a copy or a view.
change display options
pd.set_option('display.max_rows', None)
pd.reset_option('display.max_rows', None)
pd.set_option('display.max_colwidth, None)
pd.set_option('display.precision, 2)
df['new_col'] = df['col'] * 1000
pd.set_option('display.float_format', '{:,}'.format)
create a pandas DataFrame from another object
pd.DataFrame(dict, columns=['a', 'b'])
s = pd.Series([1, 2], index=['c', 'd'], name=shape)
apply a function to a pandas Series or DataFrame
df['col1'] = df['col2'].apply(function)
df['col1'] = df['col2'].apply(np.ceil)
df['col'].apply(lambda x: x[0])
df['col1'] = df['col2'].apply(np.argmax, axis=1)
MultiIndex
ser = df.groupby(['col1', 'col2']).col3.mean()	# series with multiindex
ser.unstack()	# dataframe
df.pivot_table(values='col1', index='col2', columns='col3')

df.set_index(['col1', 'col2'], inplace=True)
df.sort_index(inplace=True)
merge DataFrames
pd.concat([df1, df2])
pd.merge([df1, df2])

pd.merge(df1, df2, left_on='col1', right_on='col2')
pd.merge(df1, df2, how='inner')	#	outer left right